Troubleshooting
Run the check from the CLI
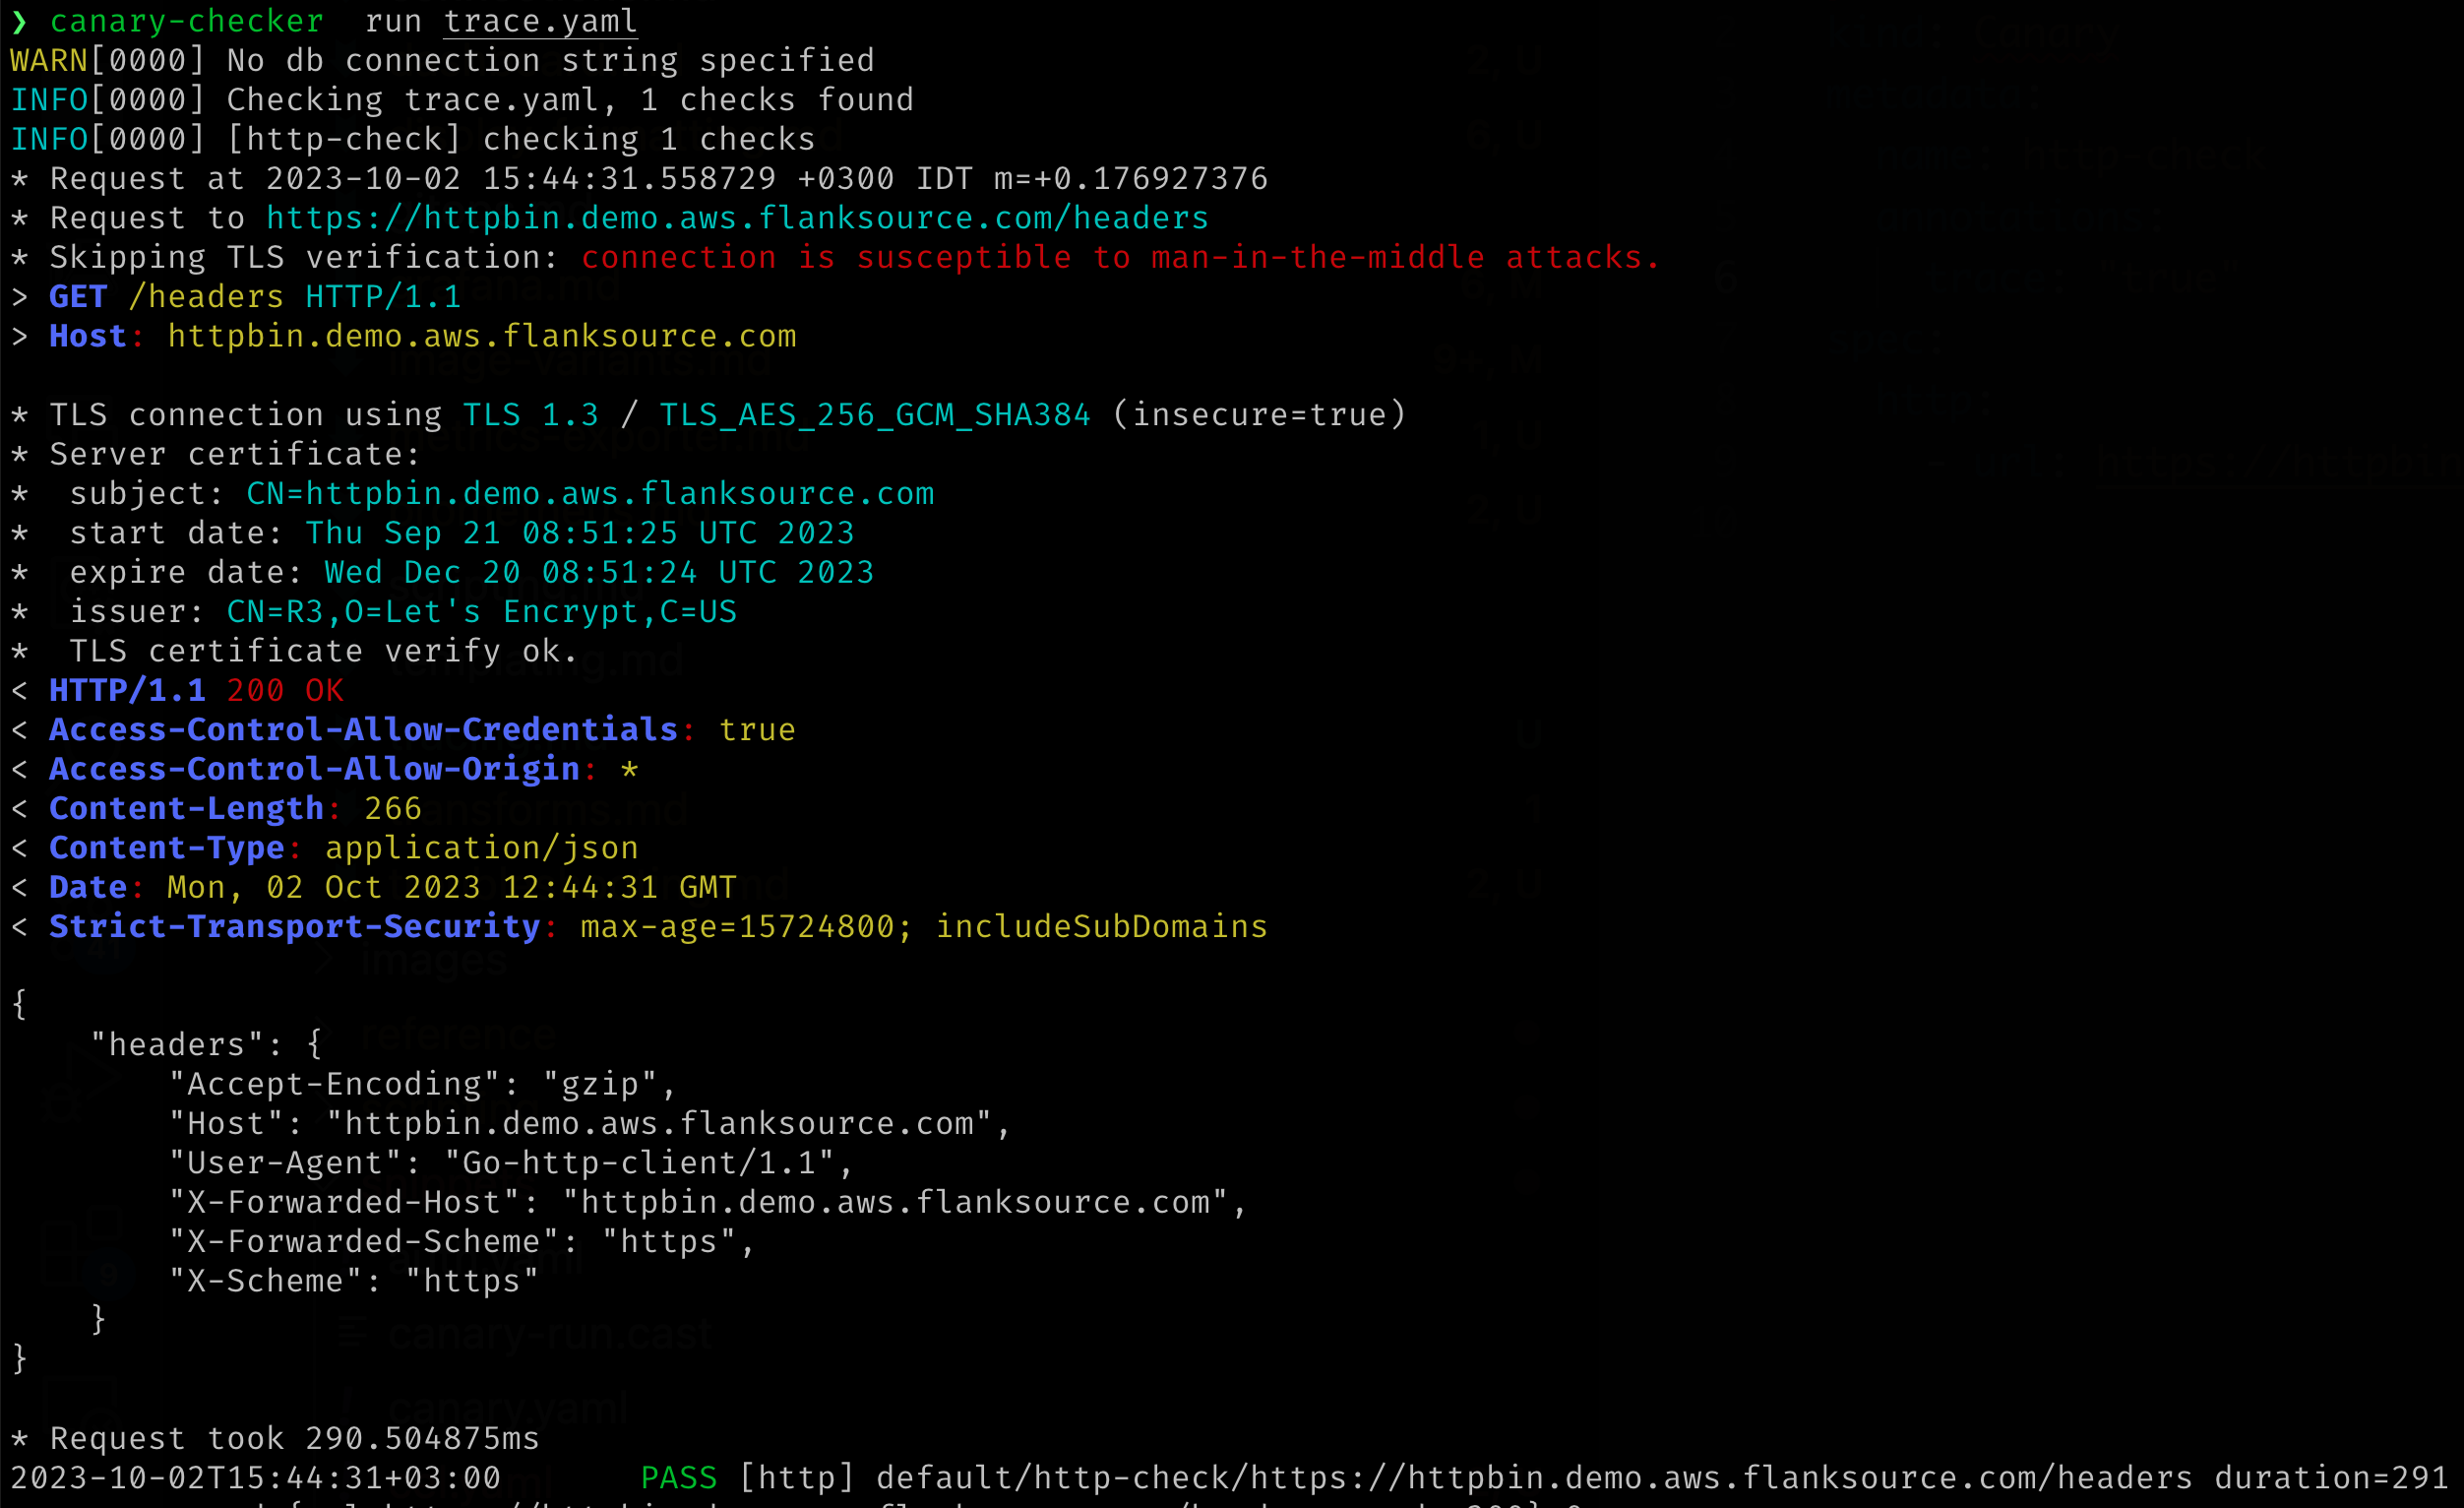
The easiest way of troubleshooting is to run the canary-checker run command with a copy of the canary CRD locally, this enables rapid feedback loops.
Enable trace and debug
To increase the amount of logs for a particular trace add a debug: true or trace: true annotation:
apiVersion: canaries.flanksource.com/v1
kind: Canary
metadata:
  name: http-check
  annotations:
    trace: "true"
spec:
  http:
    - url: https://httpbin.demo.aws.flanksource.com/headers
:::danger Sensitive Data & Excessive Logging Trace level logging will return the HTTP response body which may contain sensitive data (The authorization headers will be sanitized) :::
Trace Levels
| Level | Logs |
|---|---|
debug | - HTTP Request and Response Header |
trace | - HTTP Request and Response Header - HTTP Response Body - Custom Metrics |
Run checks immediately using next-runtime
To run a canary outside of its normal schedule add the annotation:
kubectl annotate canary <canary> next-runtime=$(date -Iseconds)
Temporarily pause a canary using suspend
kubectl annotate canary <canary> supend=true